

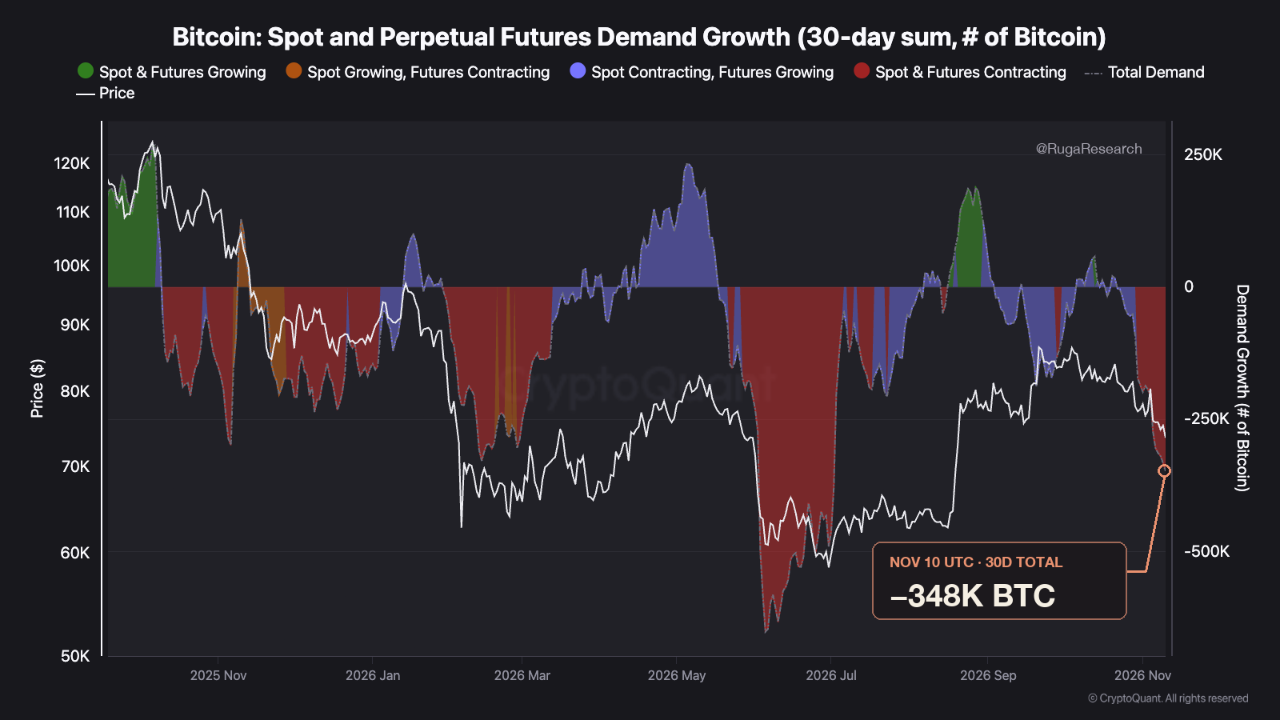
Bitcoin’s 30-day total demand estimate fell to −348K BTC on November 10, as an improvement in the spot indicator failed to offset a sharper drop in the futures-based estimate.
According to CryptoQuant data, the total demand estimate dated November 10 UTC fell to its weakest level of the month. Over the three-day period, the spot indicator recovered while the futures-based estimate declined further, pulling down the overall reading.
In the three days after November 7, the spot indicator improved by about 29,500 BTC. The perpetual futures-based estimate, meanwhile, fell by about 63,500 BTC over the same period. Both estimates remained below zero.
What conditions are being watched for a Bitcoin trading range to form?
In an analysis published on CryptoQuant, the author said they were watching the spot indicator while assessing the possibility that Bitcoin’s price could begin trading within a range. The spot demand estimate moving closer to zero and easing pressure from futures could cause the total line to flatten. The author said they would take the possibility of a trading range more seriously if the price held its lows.
The indicator covers a 30-day period; each new reading adds one day to the window and removes the oldest day. For this reason, the author is tracking how the total estimate changes over the next few daily closes, rather than focusing on a single data point.
Not investment advice.