
After This Bitcoin Signal, Even the Weakest Example Gained 50% in a Year!

An analysis comparing past periods when two moving averages crossed on Bitcoin produced striking results: Even in the weakest example examined, the price was up 50% one year later. These results are based on six past examples and do not guarantee future returns.
In a chart shared by the n3ocortex account on X, periods when Bitcoin’s 30-day simple moving average crossed back above its 50-week average are compared from the same starting point. The price on the day of each crossover is set at 1, and subsequent price movements are tracked.
Median returns of 3.3x in one year and 7x in two years
The post says the median price one year after the crossover reached 3.3 times its starting level. That represents a 230% increase. In the weakest one-year result examined, the price was up 50% from its starting point.
The median price two years later was 7 times the starting level, or a 600% increase. The median is the middle value when results are ranked; it does not mean every example produced the same return.
The chart covers crossovers in June 2012, October 2015, May 2019, January 2020, May 2020, and March 2023. Results varied widely across periods: At the two-year extremes shown in the chart, the March 2023 example reached 3.1x, while the June 2012 example reached 90.3x.
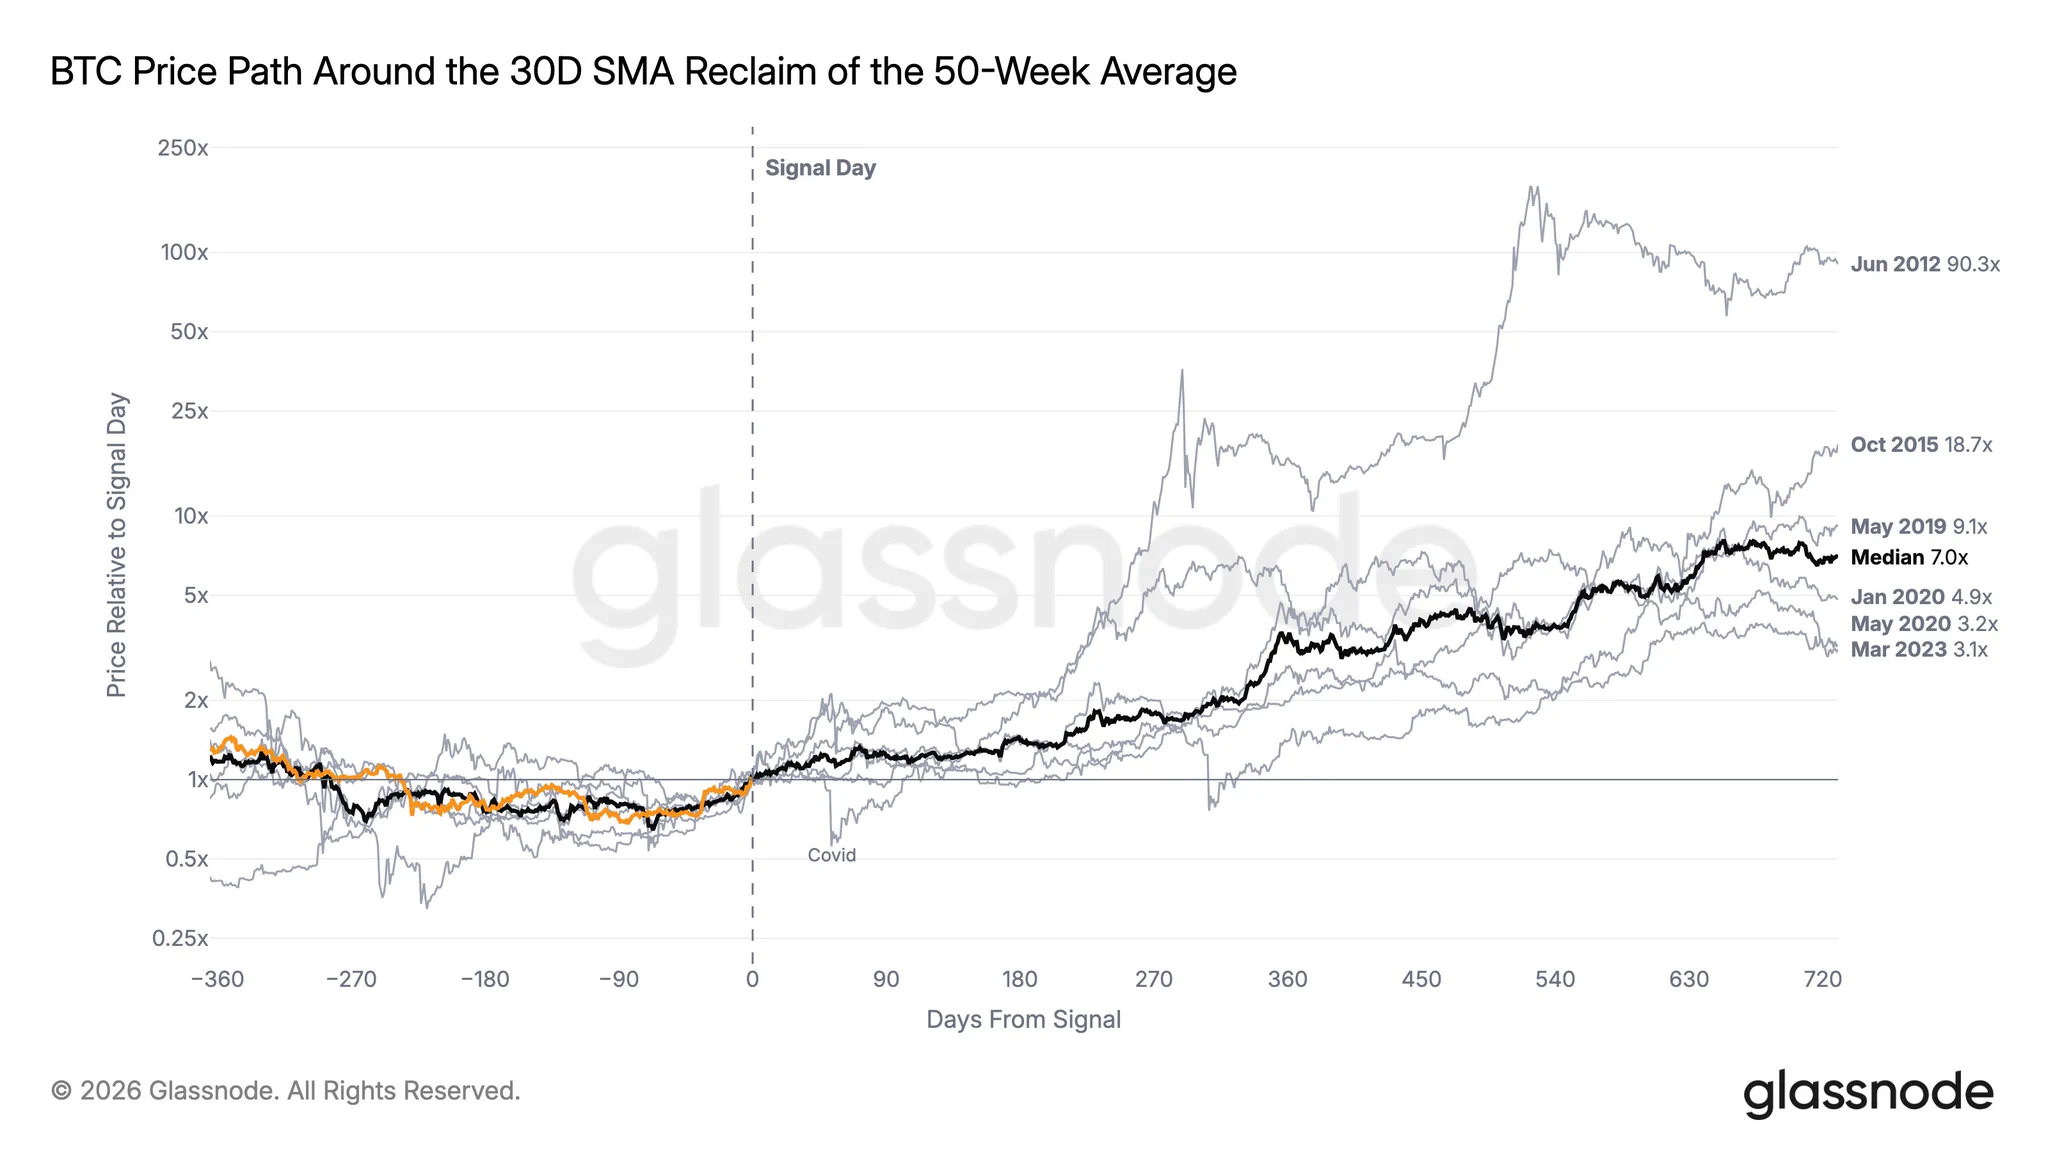
The comparison shows prices one and two years after specific crossovers; it does not indicate that prices rose steadily throughout the intervening period. The limited number of historical examples does not prove that Bitcoin will follow the same path going forward or deliver investors a gain of at least 50%.