Is a Bitcoin Bull Run Near? A Signal Seen at Past Bottoms Has Reappeared!

CryptoQuant says a pattern seen after past cycle bottoms has reappeared in the distribution of Bitcoin supply in profit and loss, suggesting the market is in the process of transitioning into a bull phase.
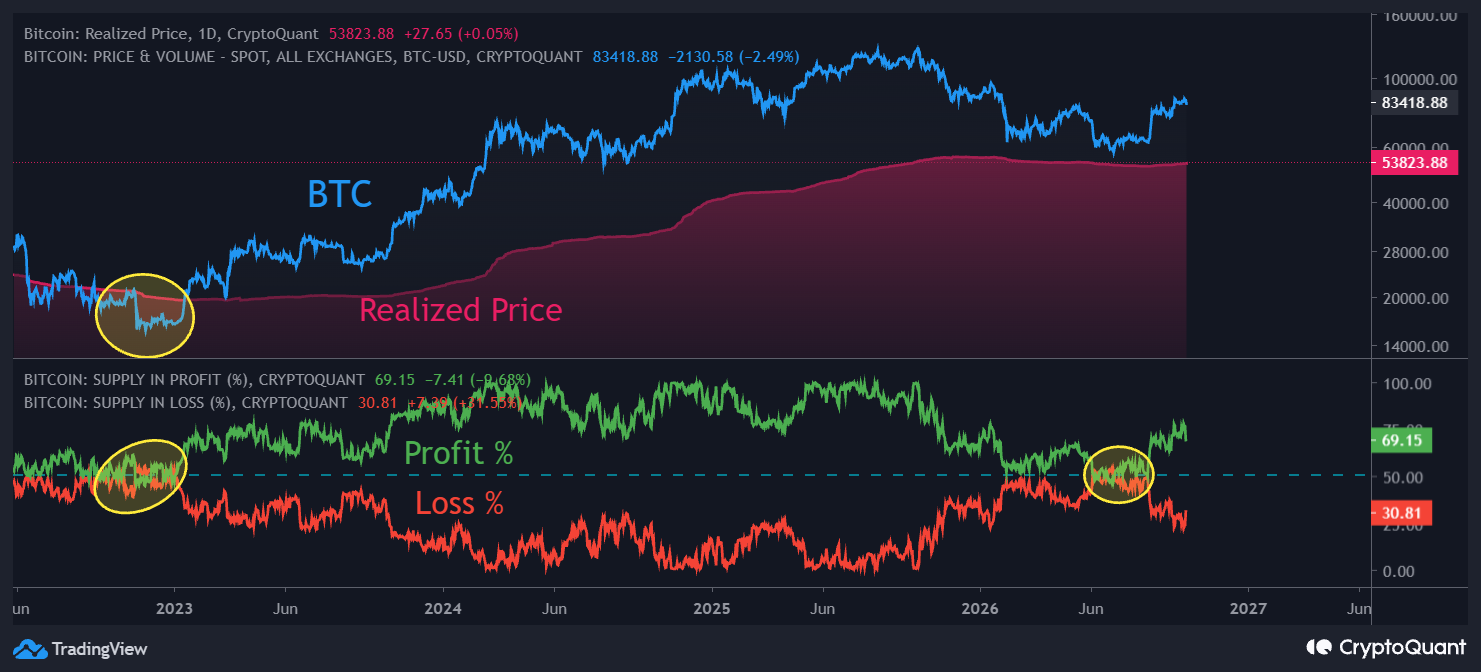
The analysis focuses not on short-term price movements but on the ratio between Bitcoin supply in profit and supply in loss. At the bottoms of previous bear cycles, these two ratios drew closer together, then diverged again as the market transitioned into a bull phase.
According to CryptoQuant, a similar divergence is taking place in the current cycle. This pattern stands out as one of the signs supporting the view that the market is beginning to turn around.
About 69% of Bitcoin Supply Is in Profit
The shared chart shows about 69% of Bitcoin supply in profit and 31% in loss. This metric tracks the profit-and-loss status of supply by comparing the price at which coins last moved on-chain with the market price shown on the chart.
The point highlighted by the analysis is not only that the share of supply in profit is higher, but also that the two ratios drew close near the bottom and then diverged again. CryptoQuant believes this historical pattern is recurring in the current picture as well.
How Is This Cycle Different From Previous Ones?
At past bottoms, Bitcoin fell below the Realized Price, an on-chain cost-basis indicator. This metric represents the average cost level calculated using the prices at which coins last moved.
CryptoQuant emphasizes that the pullback has been more limited this time. In the shared chart, the Realized Price is about $53,824, while the Bitcoin price is about $83,419; these are the values shown in the analysis chart excerpt.
Because of this difference, although the current cycle is not an exact copy of previous bottoms, CryptoQuant considers the overall picture consistent with a transition into a bull cycle.