

The rising average cost basis of recent Bitcoin investors points to the mid-$70,000s as a support zone to watch in the event of a potential pullback.
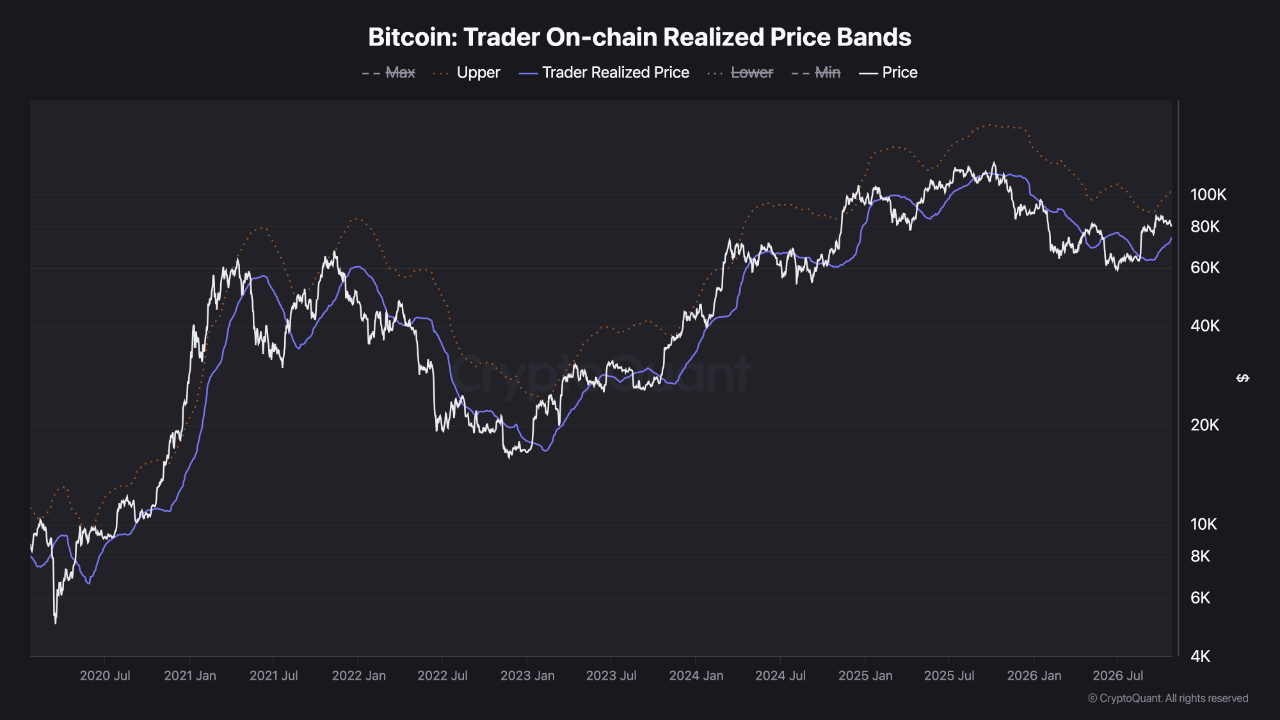
An analysis shared by CryptoQuant focuses on the relationship between Bitcoin’s price and the cost basis of coins that have moved recently. The analysis notes that while BTC is trading just above $80,000, the Trader Realized Price indicator has risen to the mid-$70,000s.
The indicator reflects the average acquisition cost of BTC that moved 1–3 months ago. This provides a reference for the cost basis of investors who entered the market relatively recently. The analysis views Bitcoin’s ability to remain above this level as positive for the short- and medium-term outlook.
Under what conditions could Bitcoin support turn into resistance?
During past rallies, the area often acted as support when the price pulled back to this cost-basis level. For that reason, if a deeper decline occurs, whether the rising cost basis holds will become important.
If the price stays below the cost basis, investor behavior can change. When the price approaches their cost basis again, investors holding at a loss may sell to break even, causing the same area to become resistance.
If the rally continues, profit-taking will be in focus
The analysis’s second scenario is that Bitcoin continues to rise. In that case, the indicator’s upper band comes into focus: historically, the price approaching this band has coincided with increased profit-taking and short-term corrections.
Both levels mark areas where investors may change their behavior; neither provides a definitive reversal signal on its own. The analysis emphasizes that the upper band does not necessarily mark a peak, nor does the cost basis necessarily mean a relief rally will follow.
Not investment advice.