
Bitcoin Surpasses 200-Day Average After 10 Months: Golden Cross Probability Strengthens

Bitcoin trading above $71,000 and rising more than 12% in the past week has strengthened golden cross expectations alongside the move above the 200-day average, though the pattern has not yet been confirmed.
According to data reported by CoinDesk, Bitcoin (BTC) is trading around $72,342.08. The recent rally has pushed the price above the 200-day simple moving average (SMA), which markets use to monitor the long-term direction.
While Bitcoin’s 50-day SMA stands at $63,976, the 200-day SMA is at $69,005. A golden cross occurs when the 50-day average crosses above the 200-day average. For the pattern to be considered valid, both averages must be moving in the same direction.
Golden cross probability strengthens for Bitcoin
The 200-day SMA shows the average of Bitcoin’s closing prices over the last 200 days. Trading sustainably above this level is considered a signal of a transition from a downtrend to an uptrend. Bitcoin had been trading below this average since October 2025; at that time, the price was approximately $110,000.
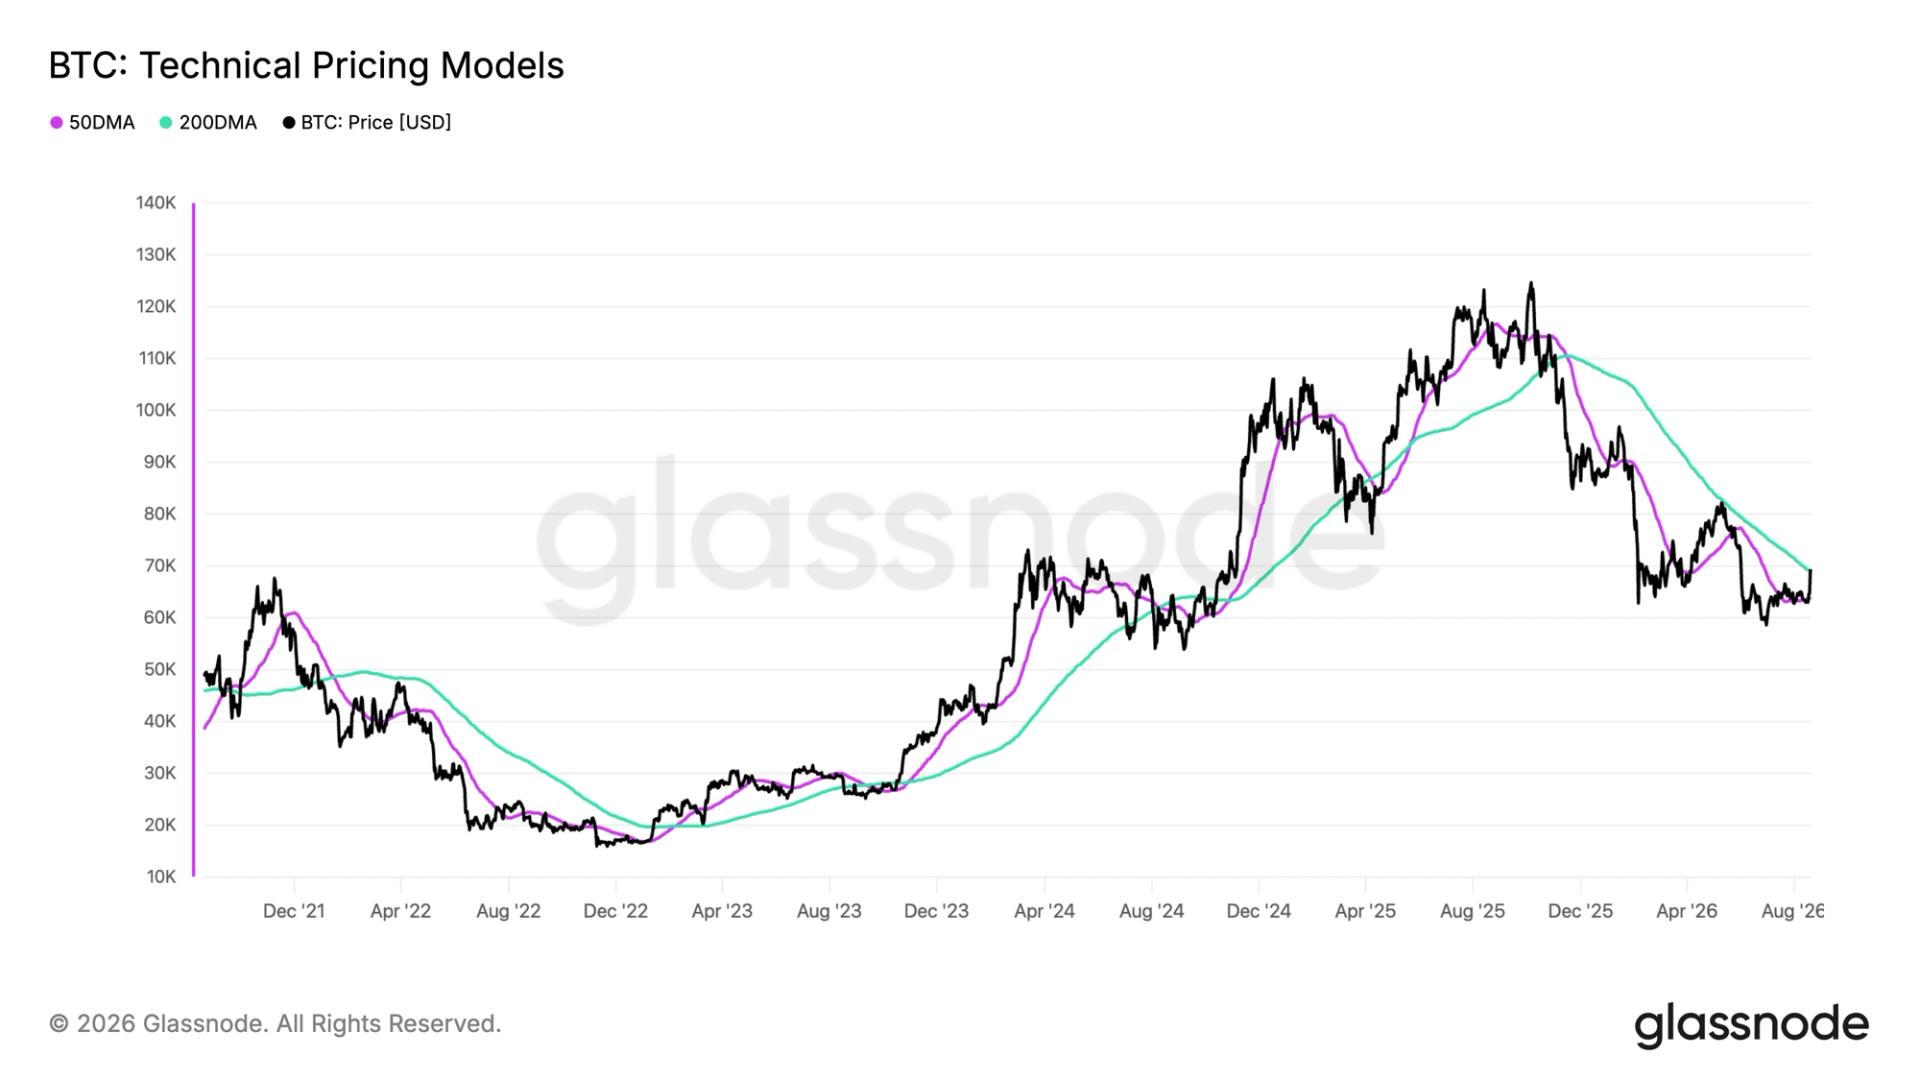
Following four golden crosses previously seen in February 2023, October 2023, October 2024, and April 2025, Bitcoin’s price experienced new rallies. However, the pattern does not guarantee a permanent rise. A return of Bitcoin below the 200 SMA could invalidate the thesis that the long-term trend has shifted in favor of the bulls.