
A Signal Accompanying Major Bitcoin Rallies Is Near—Not Seen in Over a Year!

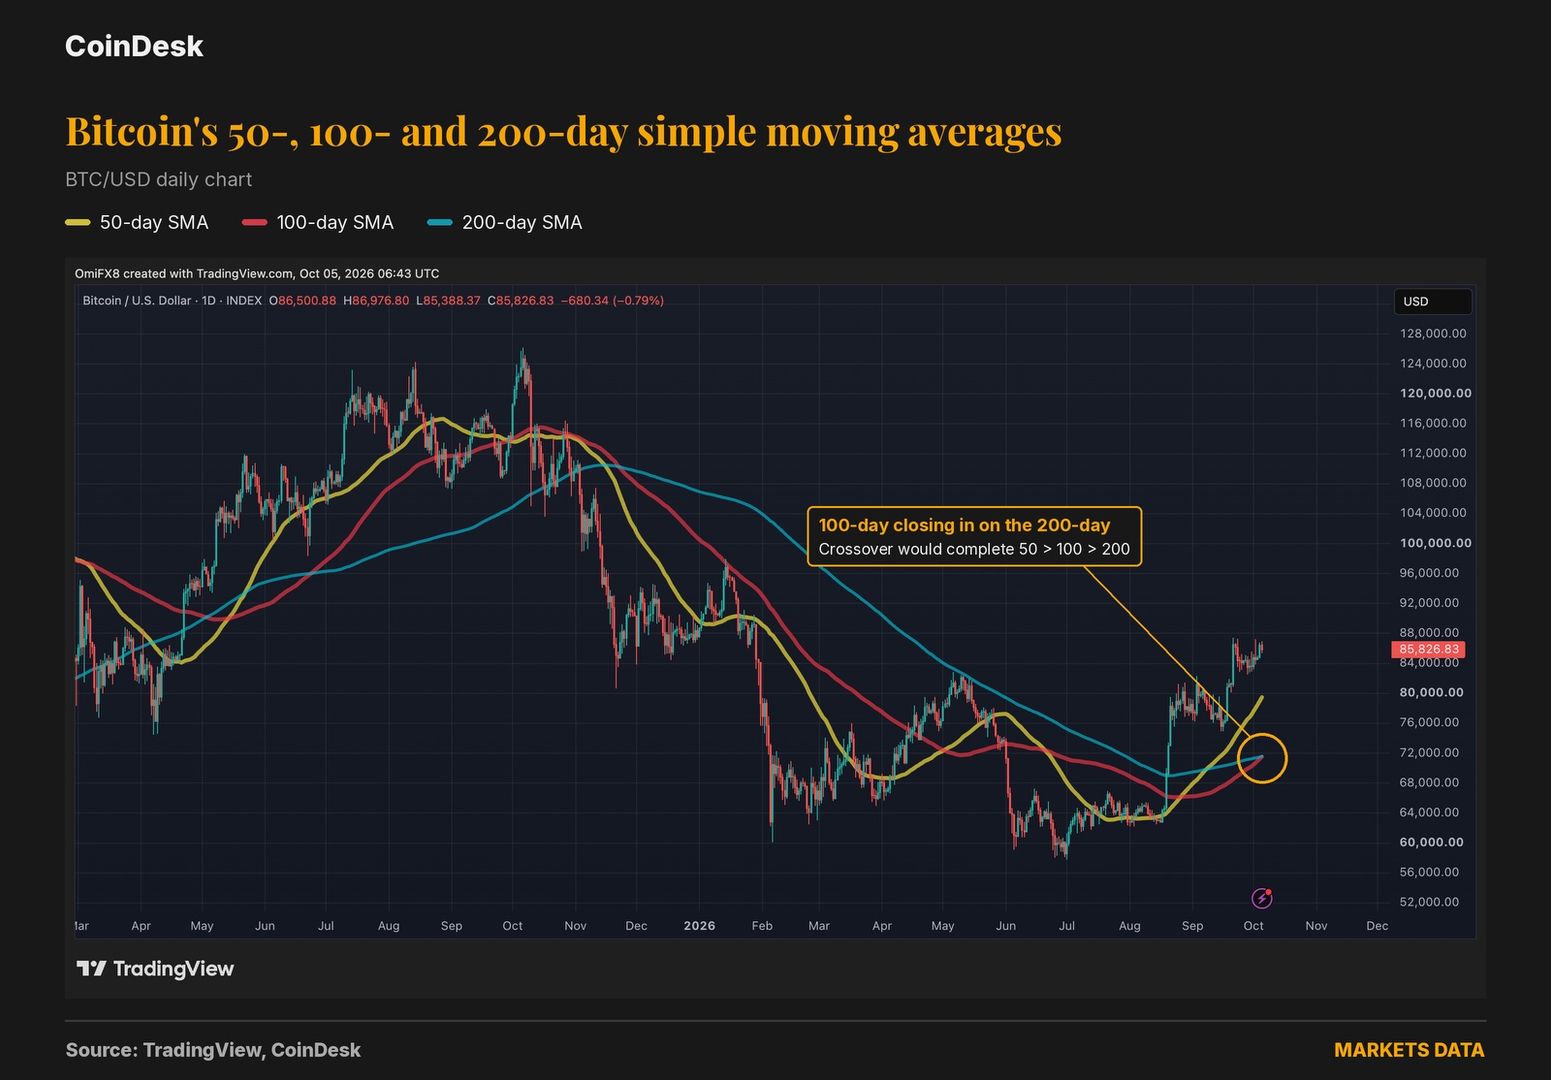
Bitcoin’s 50-, 100- and 200-day price averages are once again nearing the bullish alignment that accompanied some major rallies in the past and was last seen in June 2025.
According to CoinDesk’s analysis, the short-, medium- and long-term moving averages for Bitcoin have converged at very similar levels. Completing the expected ordering could strengthen the technical picture of the recovery in recent months.
For this alignment, the 50-day average must be above the 100-day average, and the 100-day average must be above the 200-day average. Giottus CEO Vikram Subburaj says the last time this ordering occurred was June 24, 2025.
Bitcoin’s three averages converge in the same range
According to the figures in the article, the 50-day simple moving average is at $79,495, the 100-day average is at $79,493, and the 200-day average is at $79,539.
At these levels, the 50-day average is only $2 above the 100-day average and remains below the 200-day average. For the expected bullish ordering to take shape, the 100-day average must move above the 200-day average, and the 50-day average must be above both.
When short-term averages are positioned above long-term ones, it indicates that prices in the recent period have strengthened relative to those in earlier periods. Subburaj views the approaching crossover as a sign that Bitcoin’s recovery over the past three months is continuing.
In the past, prices have also multiplied
The alignment that formed on October 27, 2020 lasted until May 2021. During that period, Bitcoin climbed from around $13,600 to above $64,000. A similar ordering that began in November 2023 remained in place until May 2024, as the price rose from around $35,000 to $73,000.
More recent examples had different outcomes. The alignment in June 2025 lasted 97 days, and Bitcoin rose from around $106,000 to $112,000. The ordering that formed in June 2024 lasted only 20 days; during that period, the price fell by around 10%.
Which level will be watched for a continuation of the rally?
Bitcoin rose more than 40% in the third quarter, approaching $87,000. The analysis notes that the rally slowed around $85,000 recently as the dollar index strengthened.
According to Subburaj, the real test will be whether Bitcoin can stay above its 50-day moving average in the event of a possible correction. The price reaction at this dynamic threshold, which is around $79,500 according to the article, will be watched to assess whether the expected alignment turns into a lasting bullish structure.